NinjaTrader 8 Indicators
List of Indicators
- DOM Column Alerts
- Last Executed Trades Column
- Depth Bars
- Pull Stack Chart Indicator
- Pull Stack DOM Column
- Filtered Volume Delta Indicator
- Fixed Auto Center Price
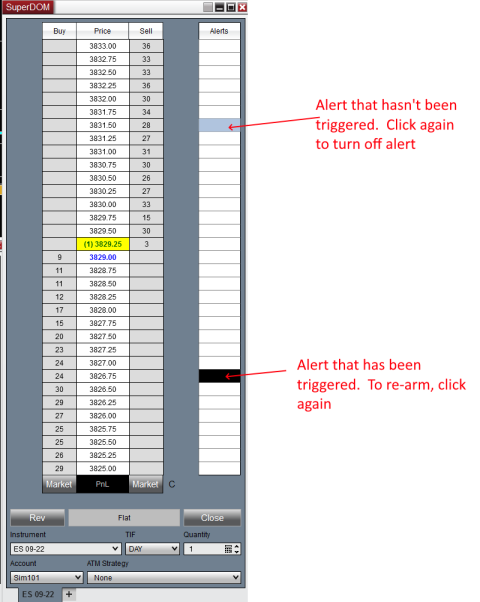
DOM Column Alerts – $10
Have you ever wanted to set an alert in Ninjatrader for a specific price. With the SuperDom Column Alerts you can do that with a single click of your mouse. You can customize the sound of the alert by downloading a wav file or selecting one of the pre-installed sounds that come with Ninjatrader located in the Ninjatrader 8 install directory => sounds (Usually C:\Program Files (x86)\NinjaTrader 8\sounds)
Last Executed Trades Column – $25
By default Ninjatrader only show the last trade in the DOM, but that by itself isn’t very helpful. To see what actually executed at each price, you can use the Last Executed Trades SuperDOM column. It will show the current bid trades and ask trades. It can show the delta at each price (horizontal / cross) and can auto-refresh to automatically clear the amount traded every few seconds or ticks of price movement. You can also swap the executed buy / sell columns to match my other SuperDOM columns if you prefer.
Depth Bars Chart Indicator – $50
The Depth Bars indicator shows changes in the total bid depth and total ask depth (requires a level 2 data subscription from your data provider) in a sub-panel along with delta. The indicator is customizable to calculate the book depth up to the 10,000 inside levels. This will give you an idea of who is in control of the market and when players are about to fold. Using this indicator with delta will enable you to be one step ahead of other traders using normal delta in isolation.
This is a short-term order flow tool. It was designed for charts with bars types such as tick or second granularity. Success with this indicator requires an understanding of market participants positioning. The key insight is to recognize when late traders are trapped using price action or volume profile.
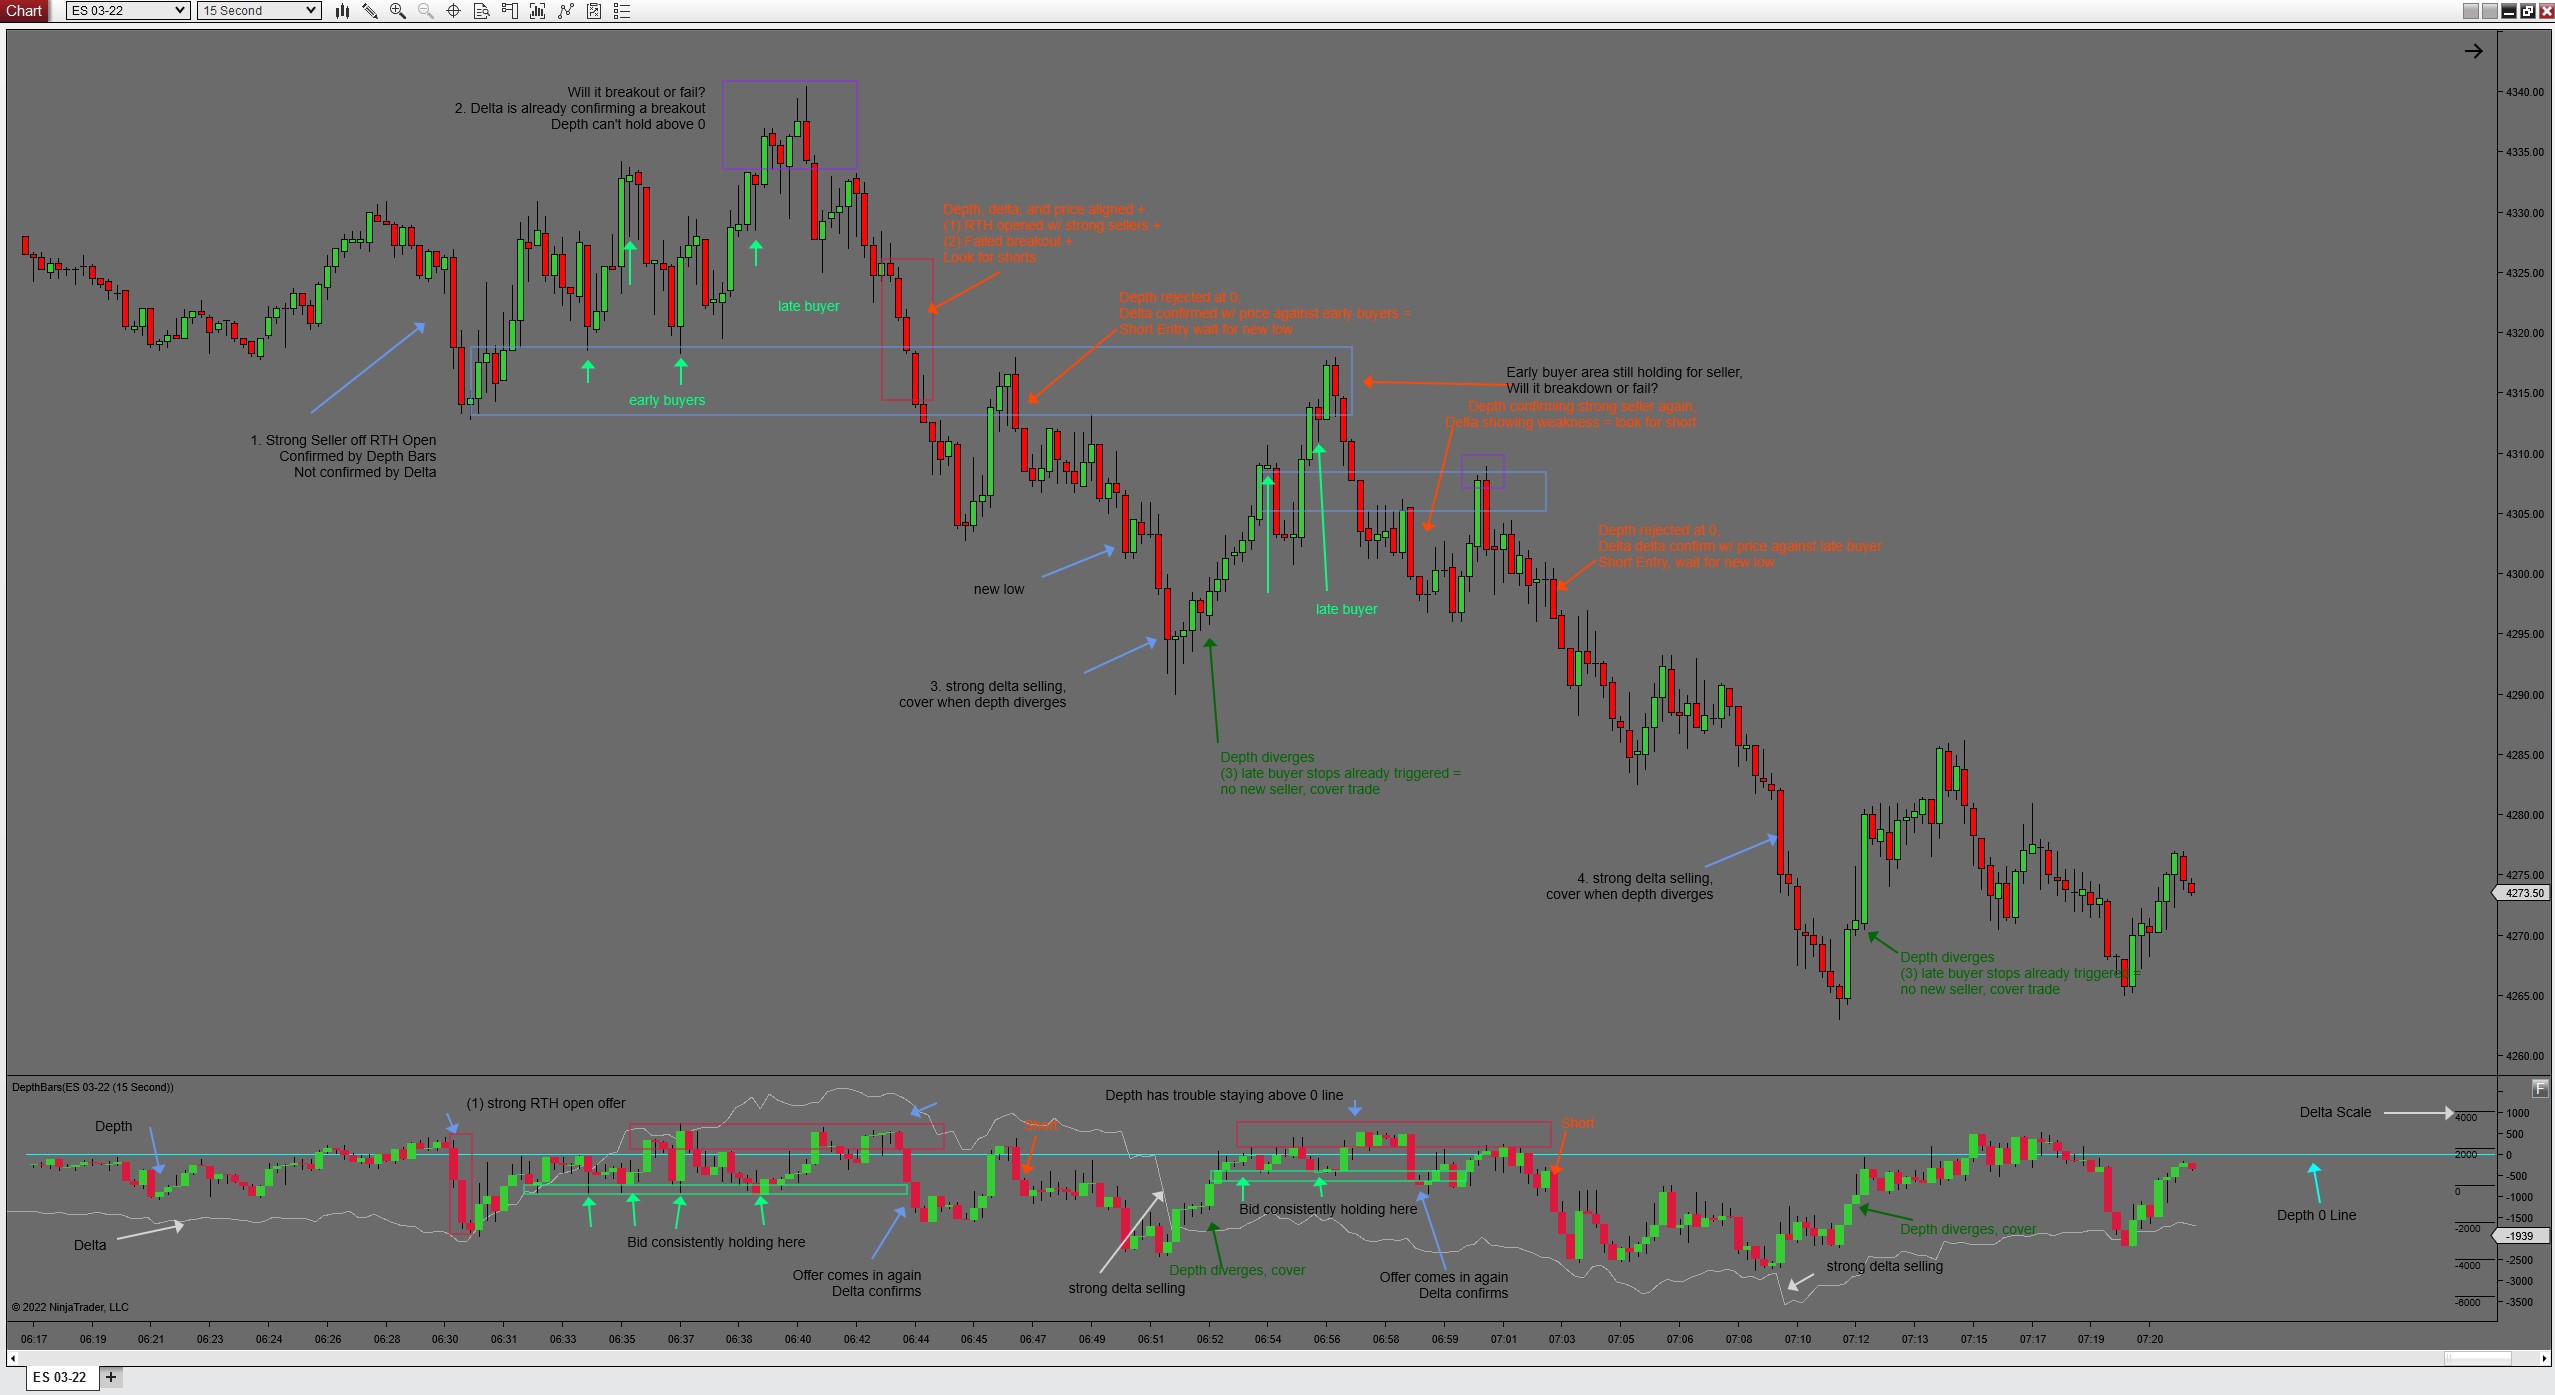
Note the example below. The day starts with strong sellers shown by price immediately trading lower and a significant negative order book skew. As the weakness in the order book is maintained throughout the opening swing, late buyers become trapped and the market quickly auctions lower. Using the depth bars indicator will help you identify this situation real-time to participate in the advertisement of lower prices.
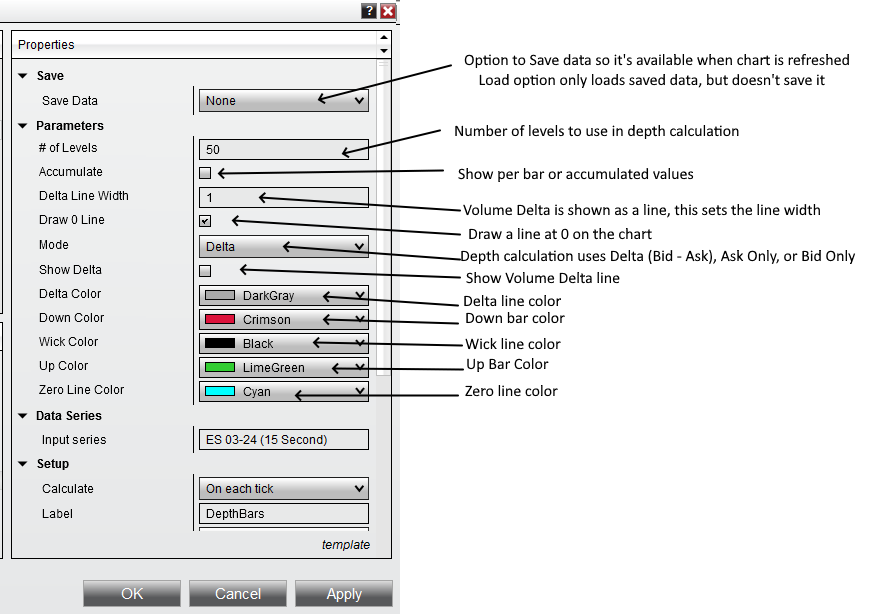
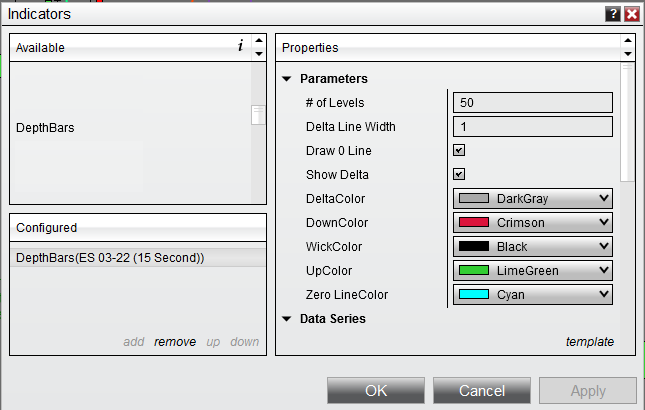
The typical settings for trading E-mini S&P futures are shown below. The colors are customizable. Delta and the Depth 0 line can be shown or hidden. The number of levels can be set from 1 to 10000.
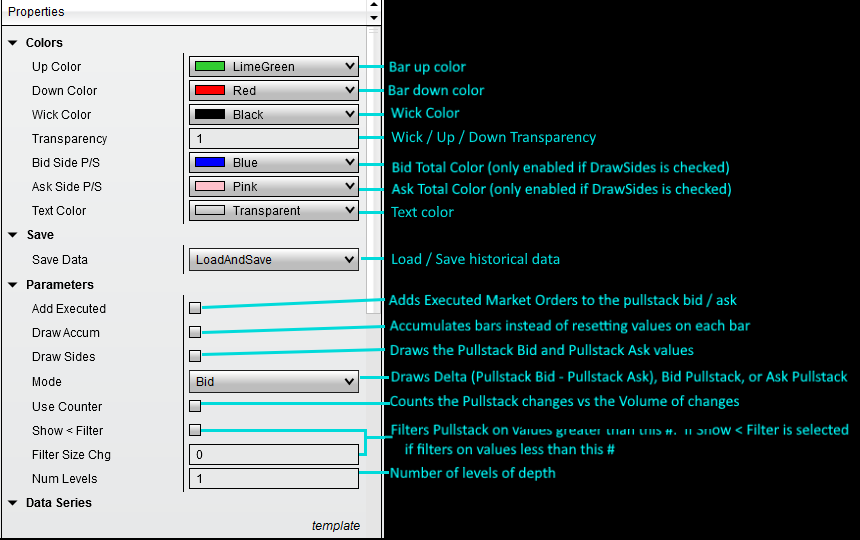
Pull Stack Chart Indicator – $100
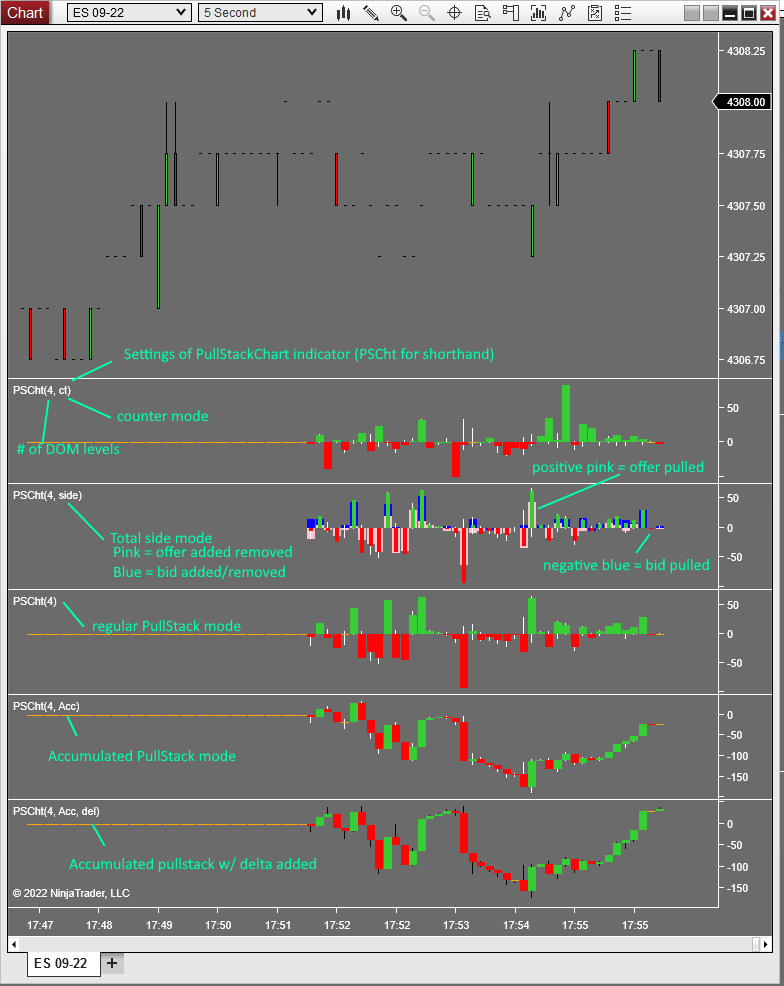
Similar to the Depth Bars indicator that calculates the total size of the bid or ask, the Pull Stack Chart Indicator looks for changes in the book (requires a level 2 data subscription from your data provider). There are a variety of modes you can use to calculate the Pull Stack shown in the image below. My recommended settings are to use the inside 4 prices for ES.
Other platforms have pull-stack indicators but they don’t calculate it correctly because they reset the inside pull-stack values on inside bid / ask changes, giving erroneous values. The PureAlgo Pullstack indicator also offers a way to separate Delta from the Depth. Independently observing the aggressive vs passive players offers additional insight into auction
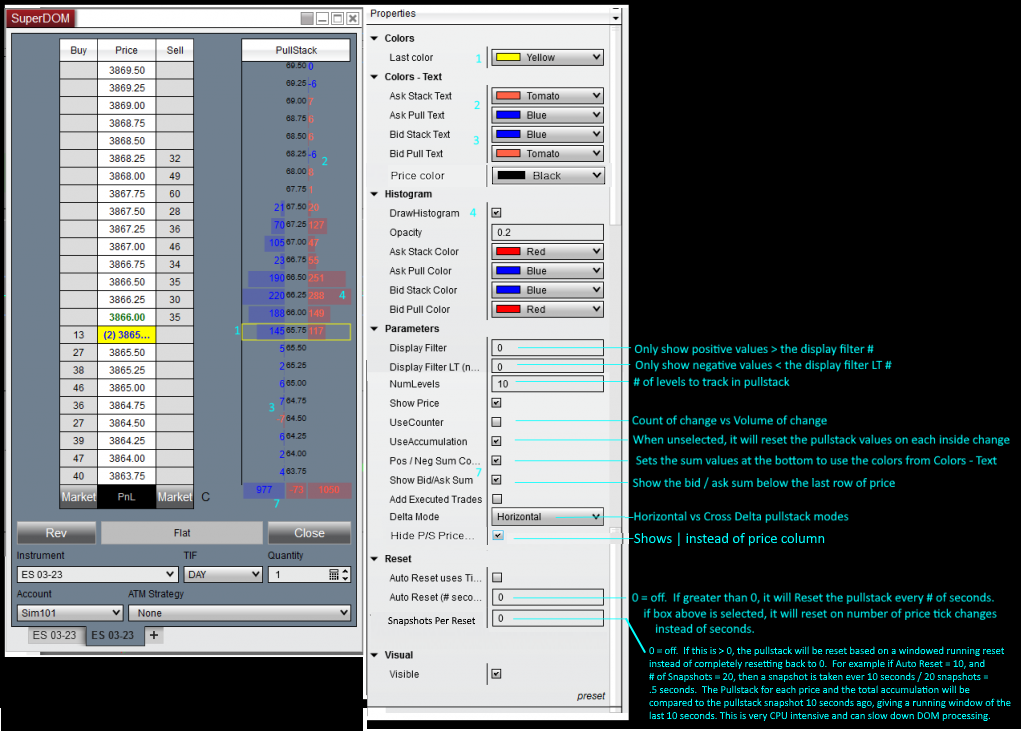
Pull Stack SuperDOM Column – $50
The Pull Stack SuperDOM Column shows similar information to the Pull Stack chart indicator but gives you a per price view (requires a level 2 data subscription from your data provider). This is helpful to identify exactly where and how orders are being placed. There are 4 states you can track using the settings in this indicator by checking combinations of the UseCounter and UseAccumulation check boxes. In addition the pull stack accumulated values are shown at the bottom of the DOM
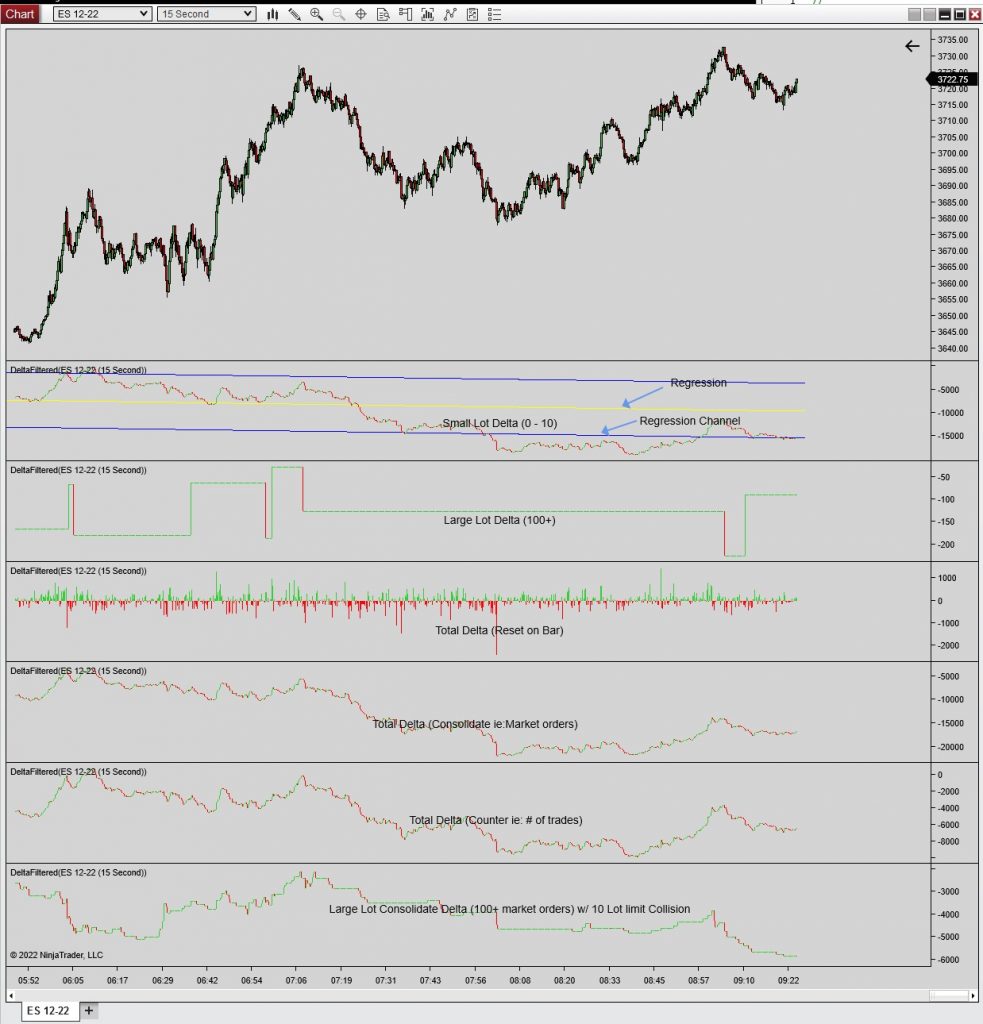
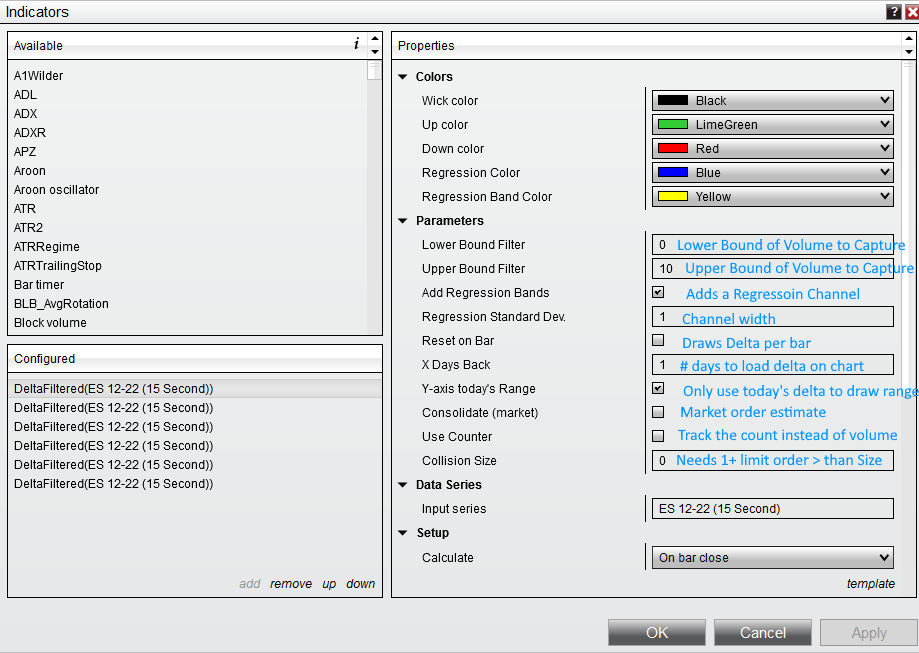
Volume Delta Filtered Chart Indicator – $50
Tracking the size of different executed orders in the market can help identify the types of players that are currently active. The Volume Delta Filtered Chart Indicator can be set up to show various ranges of order sizes to help you track the different executed order sizes.
It has a non-accumulation mode so you can identify per bar changes. In addition, you can also track the number of orders executed instead of the volume of the orders to give you an idea of the sizes executed. Finally it has a consolidated tape option that groups limit orders into market orders. (Until Ninjatrader and their data providers implement MDP 3.0, this is just an estimation based on how level 1 data is dispersed based on the CME specifications)
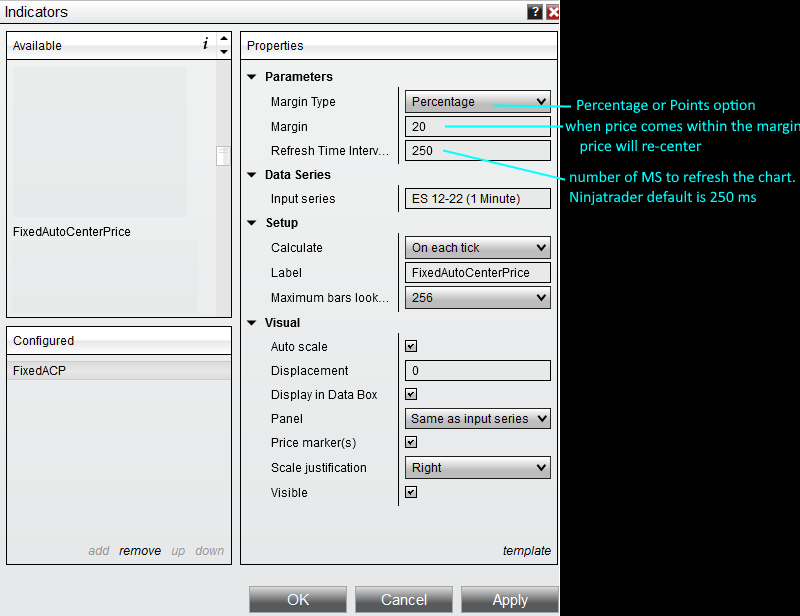
Fixed Auto-Center Price – $10
Don’t you find it annoying that Ninjatrader’s Fixed Price Scale doesn’t automatically re-center when price goes off the screen? Well worry no more! The Fixed Auto-Center Price indicator will automatically re-center price when price gets near the edge of a chart based on the margin you set. You can set the margin to be a fixed percentage or a fixed amount of points.
In addition, Ninjatrader’s charts only update 4 times / second (every 250 ms or 4 Hz). The human eye can see changes down to about 15 ms or 67 Hz. By setting the Refresh Time Interval option to a value less than 250 ms, you will get faster updates on your charts. Note that this is can cause heavy resource usage and actually SLOW down your computer during extremely fast market conditions so I don’t recommend using fast updates on more than 1 chart and no faster than 15 ms. I only keep my entry chart at 50 ms.